Building a Near Real-time Data Pipeline and Dashboard with Python and Dash
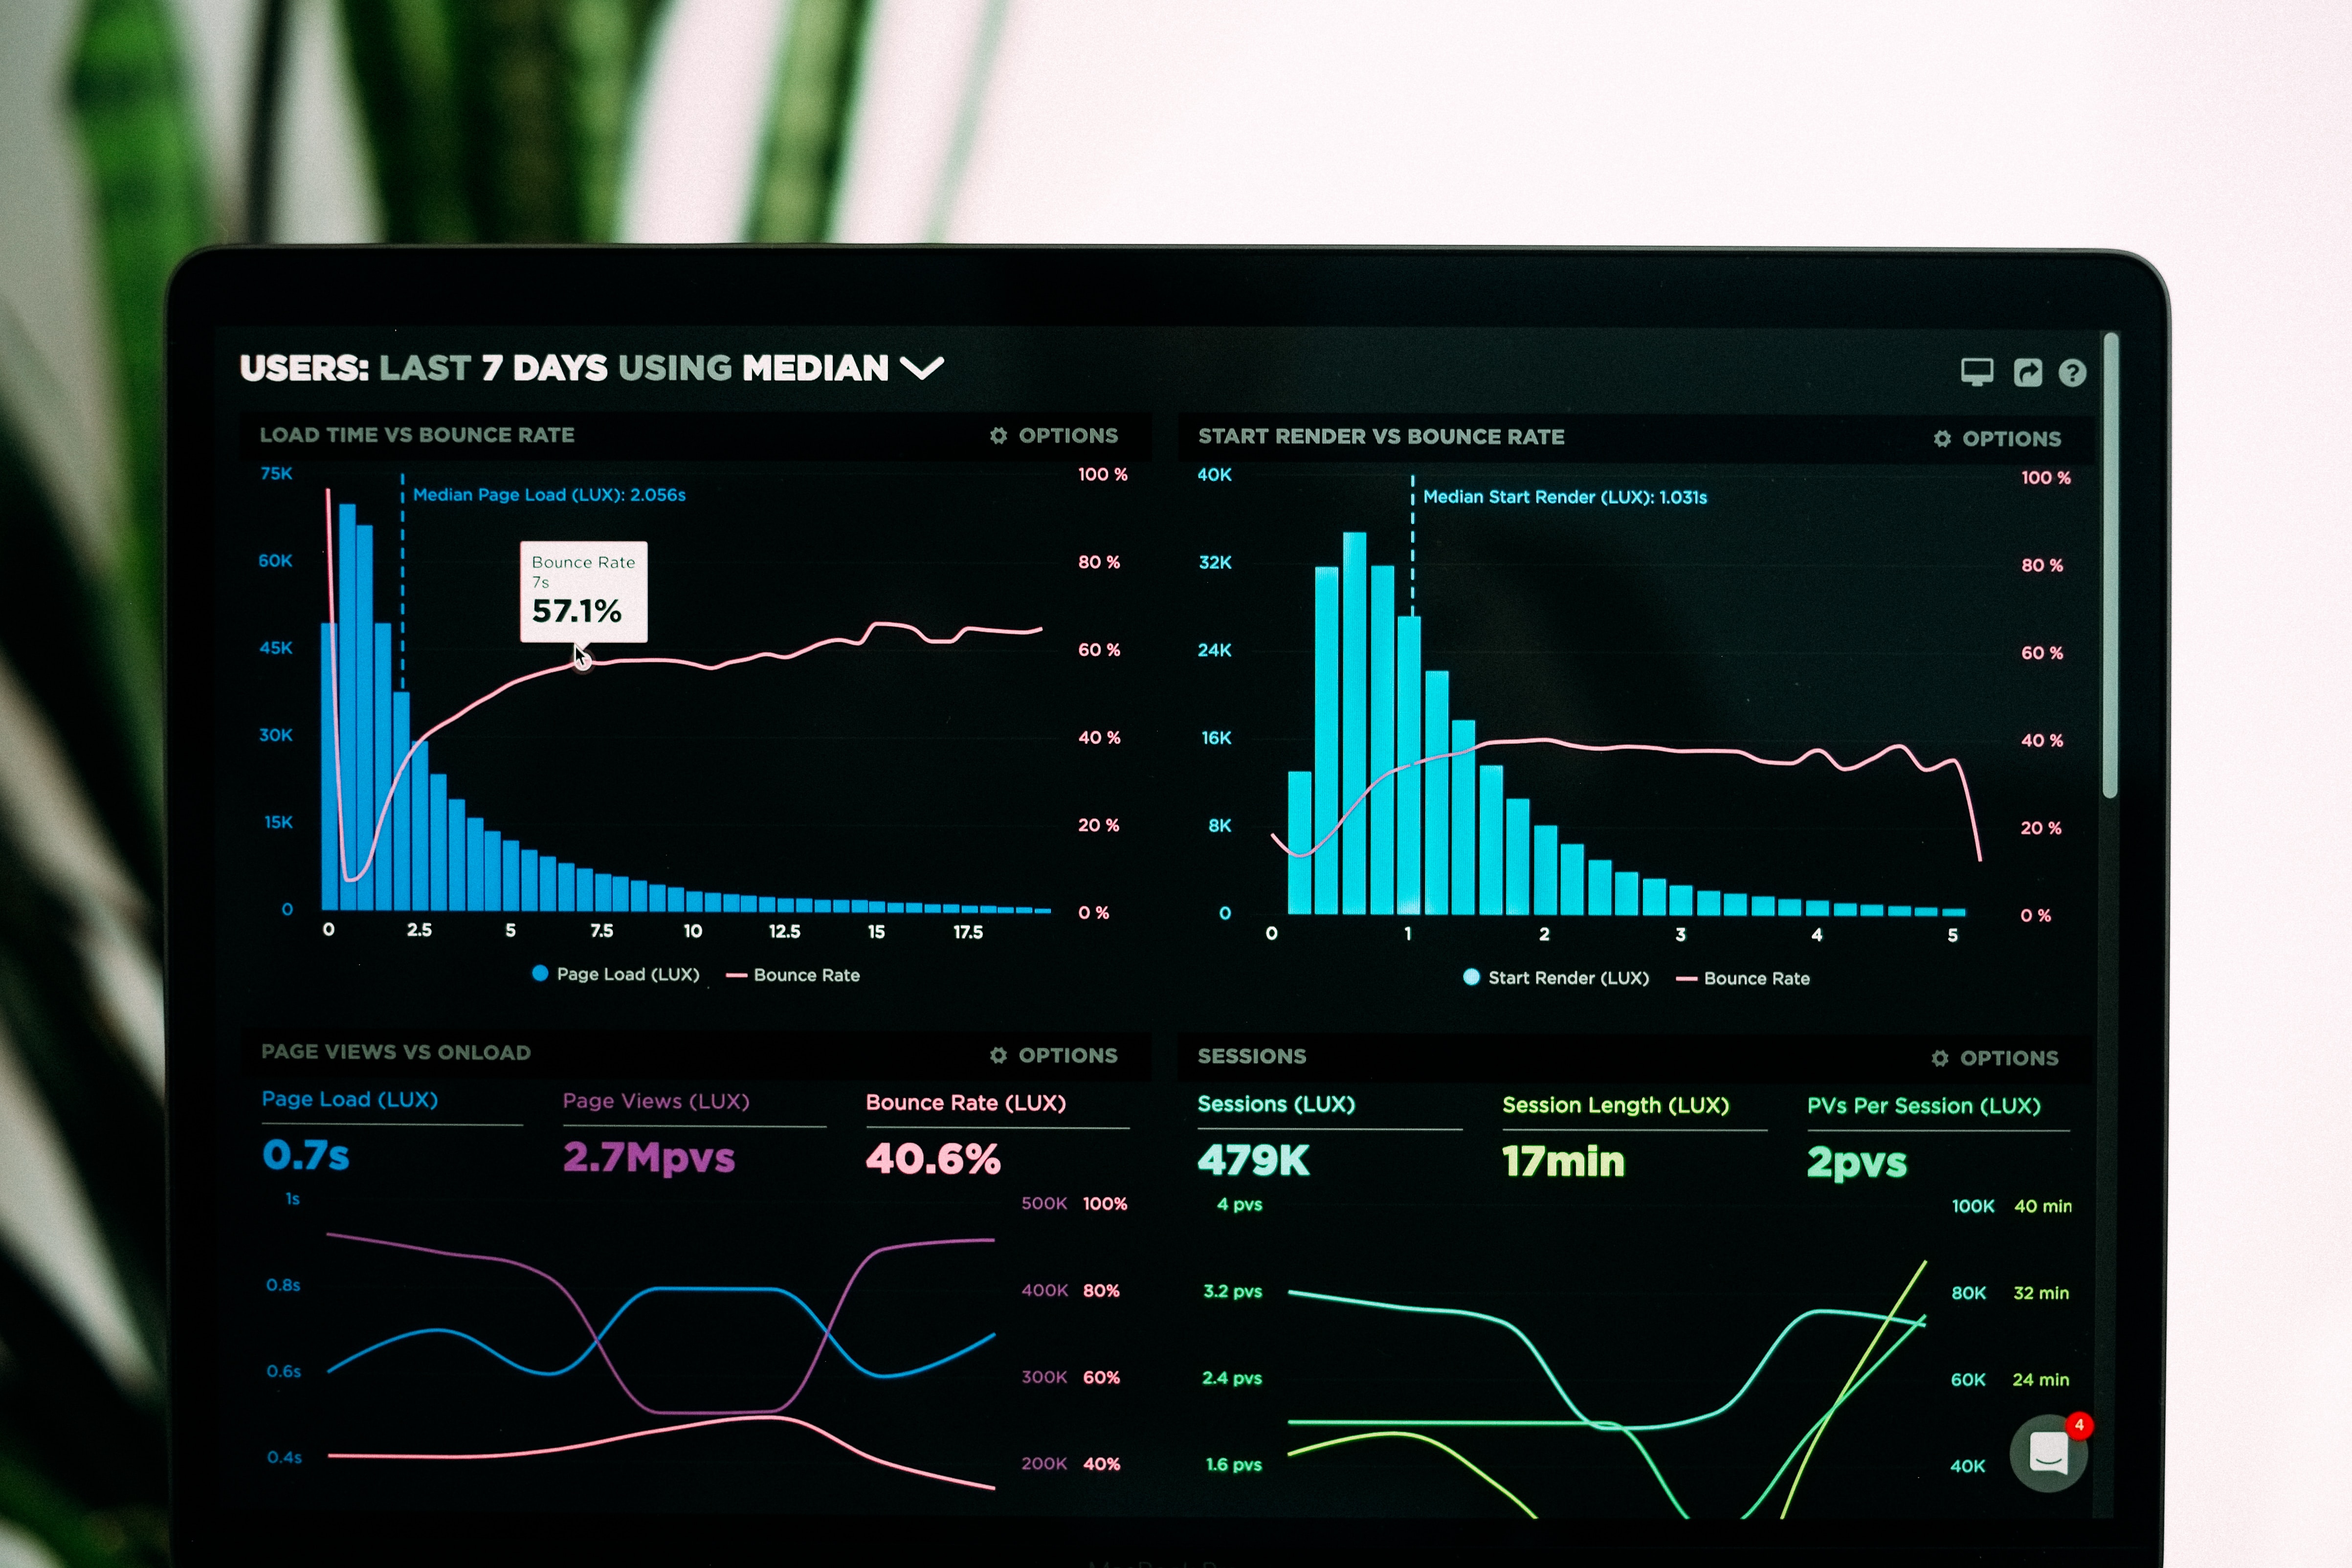
In this follow-up blog post, we will demonstrate how to build a near real-time data pipeline using Python and create a dashboard with Dash to display various metrics being updated in real-time. We will use the CSV data from the previous blog post as our data source.
To follow this tutorial, you will need:
- Python 3.x installed on your system
- The following Python libraries: pandas, numpy, dash, dash_core_components, dash_html_components, and plotly
Data Preparation
Let's assume we have a CSV file called 'sample_data.csv' with the following content:
timestamp,temperature,humidity,pressure
1629481200,72,43,1010
1629484800,73,42,1009
1629488400,74,41,1008
Building the Data Pipeline
We will use Python to read and process the data from the CSV file. First, we will create a simple function that reads the CSV file and returns the data as a pandas DataFrame:
import pandas as pddef read_data(file_path):data = pd.read_csv(file_path, parse_dates=['timestamp'], index_col='timestamp')return datadata = read_data('sample_data.csv')
Creating the Dashboard with Dash
Next, we will create a dashboard using Dash to display the metrics from our data in real-time. Install the required libraries with the following command:
pip install dash dash_core_components dash_html_components plotlyNow, create a new Python file called 'dashboard.py' and add the following code to set up the basic structure of the dashboard:
import dashimport dash_core_components as dccimport dash_html_components as htmlfrom dash.dependencies import Input, Outputimport plotly.graph_objs as goapp = dash.Dash(__name__)app.layout = html.Div([dcc.Interval(id='interval-component', interval=1000, n_intervals=0),html.Div(id='live-update-text'),dcc.Graph(id='live-update-graph')])import pandas as pddef read_data(file_path):data = pd.read_csv(file_path, parse_dates=['timestamp'], index_col='timestamp')return data@app.callback(Output('live-update-text', 'children'),[Input('interval-component', 'n_intervals')])def update_metrics(n):data = read_data('sample_data.csv')latest_data = data.iloc[-1]style = {'padding': '5px', 'fontSize': '16px'}return [html.Span(f"Temperature: {latest_data['temperature']} F", style=style),html.Span(f"Humidity: {latest_data['humidity']} %", style=style),html.Span(f"Pressure: {latest_data['pressure']} hPa", style=style)]@app.callback(Output('live-update-graph', 'figure'),[Input('interval-component', 'n_intervals')])def update_graph(n):data = read_data('sample_data.csv')trace = go.Scatter(x=data.index, y=data['temperature'], name='Temperature', mode='lines+markers')layout = go.Layout(title='Temperature Over Time', xaxis=dict(title='Timestamp'), yaxis=dict(title='Temperature (F)'))return {'data': [trace], 'layout': layout}if __name__ == '__main__':app.run_server(debug=True)
To run the dashboard, simply execute the 'dashboard.py' script:
python dashboard.pyIn this blog post, we demonstrated how to build a near real-time data pipeline using Python and create a dashboard with Dash to display various metrics being updated in real-time. This example used a simple CSV file as the data source, but the same principles can be applied to other data sources like databases, APIs, or streaming data.
By combining Python's powerful data processing capabilities with Dash's interactive visualization features, data engineers can quickly and easily create real-time dashboards for monitoring and analyzing their data pipelines. This approach can be further extended to support more complex scenarios, such as handling larger volumes of data or integrating with other data processing and visualization tools.


